Businesses today, it’s probably safe to say, are just swimming in information. I mean, really, there’s data everywhere you look, from what customers are doing to how internal operations are humming along. All that data gives us some pretty critical insights, right? And yet, you know, one really crucial area often seems a little bit slower to catch on, maybe to really embrace that data-first kind of thinking.
I’m talking about recruitment, of course. For what feels like a long time now, hiring decisions have often just sort of… relied on gut feelings, or maybe just doing things the way they’ve always been done, you know, those traditional methods and subjective assessments. Learn how to use data to improve your recruitment process and hire better candidates. And honestly, that can lead to some pretty costly mistakes. You miss out on great people, things become inefficient. It’s probably time, I think, to move past just guessing and really start using the power of data to build those better teams we all want.
Just imagine, if you can, a recruitment process where you have a really clear idea – you know precisely – which places you’re looking for candidates (which sourcing channels, in the jargon) actually bring in the highest-performing folks. Or which interview questions, maybe, genuinely predict success. Or, where on earth candidates are dropping off in the process. That’s not just wishful thinking, is it? That’s the reality that data-driven hiring can make happen. By simply applying analytics – which is just a fancy word for looking at the numbers systematically – to every single stage of finding and hiring talent, companies can totally transform how they approach it.
This post here is going to walk you through that journey, really, of using data, your regular reporting, and definitely specialized HR analytics software to make your recruitment process better. You want it to be more effective, sure, but also more efficient, and probably fairer too. We’ll cover the ‘why’ – why bother with all this data? The ‘what’ – what data should you even look at? And the ‘how’ – how do you actually do the analysis? We’ll touch on essential tools, talk about getting it all implemented, and yes, look at how to get past some of those common bumps in the road. So, let’s try and stop just guessing, perhaps, and start doing a bit more measuring.
The Undeniable ‘Why’ – Benefits of Data-Driven Recruitment
Making hiring decisions based just on a hunch or maybe sticking to old habits feels increasingly risky these days, especially in a talent market that’s just so competitive. You’ve got the high costs, the drawn-out hiring cycles, and, you know, probably most important, the real impact a bad hire can have. It can genuinely hurt a business quite a bit. Research seems to consistently show, time and again, that getting a hiring decision wrong can set a company back by tens of thousands of dollars. Sometimes, maybe even more. I remember reading something that put the average cost of a bad hire up to 30% of that person’s first-year earnings – that was from a U.S. Department of Labor report, I think. So, really, leaning into data offers what looks like a pretty clear way to lower those risks and, hopefully, get much better results.
The Strategic Advantage of Using Data in Recruitment
Thinking about it, data really helps move talent acquisition from being, well, maybe a bit reactive and just kind of administrative, to being genuinely strategic and proactive. It swaps out those subjective opinions for objective evidence, which just lets you make more informed choices all along the way. It’s definitely not about getting rid of the human side of things, not at all. It’s more about giving that human element solid facts to work with. You gain this ability, you see, to spot patterns and connections that, frankly, human judgment working alone might just miss.
Using data – and predictive analytics in recruitment, which is kind of the next level – allows organizations to, say, anticipate future needs for talent. They can also start identifying which candidates are most likely to really thrive. That, right there, gives companies a pretty significant competitive edge. They can build stronger teams, and maybe build them faster. They keep their best people longer, hopefully, and can adjust more quickly when the market shifts, which it does, doesn’t it? Data, you could say, provides the intelligence you need to kind of stay ahead of the curve.
Improving Quality of Hire
Quality of Hire is, you could argue, maybe the single most critical recruitment metric. It’s essentially about the value those new people bring to the company, isn’t it? Measuring it means looking beyond just getting someone to accept an offer. Data lets you link what you knew before you hired them (like where they came from, their assessment scores, how interviews went) with how they actually perform after they join (performance reviews, how long they stick around, what impact they have).
When you really look at this data, you can see which sources seem to consistently bring in high-performing employees. It also helps you check if your assessment methods or how you structure interviews are actually working, or maybe not so much. This whole loop, where you use post-hire data to check your pre-hire decisions, is absolutely vital for constantly tweaking how you select people and just improving the overall standard of folks you bring in. It helps make sure you’re not just filling empty seats, you know? You’re filling them with the right people.
Reducing Time-to-Hire and Cost-per-Hire
These two, time-to-hire and cost-per-hire, are really about efficiency, and they definitely affect the bottom line and how quickly an organization can move. Time-to-Hire is just how long it takes from putting a job out there to getting an accepted offer. Cost-per-Hire is, well, pretty straightforward, it’s the total money spent divided by how many people you hired. Both are pretty important signs of how efficient your recruitment is running.
Looking closely at data helps you spot where things are getting stuck in the hiring process. For instance, the data might point out that interview scheduling is taking way too long, or maybe that candidates are just not moving forward after the second interview stage. By really nailing down those specific issues, recruiters can focus their efforts on fixing those particular steps. Data also helps you figure out where to spend your resources most effectively. You make sure your budget and time are going towards the stuff that actually works, which, naturally, helps bring those overall costs down.
Enhancing Candidate Experience
In today’s job market, how candidates feel about going through your hiring process really, really matters. It has a big impact on your company’s brand and whether you can attract good people. If someone has a bad experience, they might turn down an offer, or even worse, tell others and discourage future applications. Data, happily, can give you a pretty direct window into how candidates actually see your process.
Candidate satisfaction surveys, especially when you look at them alongside data showing where candidates drop out of the funnel, can really show you the pain points. A lot of people leaving the process at certain stages might suggest, for example, that your application form is a pain to fill out, or maybe those interviews weren’t great experiences. Insights you get from data let you make targeted improvements, making the process smoother, hopefully more transparent, and just a more positive experience for everyone who applies, even if they don’t end up getting the job.
Boosting Diversity, Equity, and Inclusion (DEI)
DEI isn’t just a nice-to-have anymore, is it? It’s a strategic must. And data, frankly, is an absolutely essential tool for getting there. Tracking representation at every single step of the recruitment funnel is so important. Your Applicant Tracking System (ATS) and, yes, your HR analytics software can help track candidate demographics – where candidates are willing to share that info, of course, and where it’s legal.
Analyzing this data helps you see where potential biases or perhaps systemic barriers might be hiding. Are candidates from underrepresented groups getting into the funnel but then just not moving past a certain interview round? Is the offer acceptance rate lower for particular groups? Data provides the actual evidence you need to address unconscious bias, whether that’s in how you write job descriptions, where you look for candidates, or how you evaluate people. Ultimately, it helps you build a hiring environment that feels more equitable.
Increasing Recruitment ROI
Let’s face it, recruitment is an investment for any business. And companies absolutely need to understand what kind of return they’re getting on that investment. Data-driven hiring does a pretty good job of directly connecting recruitment activities to what the business actually achieves. By looking at Quality of Hire alongside things like Cost-per-Hire and Time-to-Hire, you just get a much clearer picture of how efficient and how effective your recruitment spending really is.
When you can see which channels are bringing in the best talent – the people who stay longer and do better work – you can then strategically decide where to put your budget. You can invest more in those channels that are giving you a great return and maybe pull back from the ones that aren’t really delivering. This way of looking at things means the recruitment function isn’t just seen as a cost center, you know? It becomes a measurable part of what makes the business successful.
The ‘What’ – Key Recruitment Metrics to Track and Analyze
Okay, so actually doing data-driven hiring means you need to figure out what data is even out there and available, and then what metrics are going to be the most useful for you. All that raw data, coming from different places, needs to be brought together, cleaned up (because data is rarely perfect, is it?), and organized. That really is the absolute foundational step for getting any meaningful Hiring Data Analysis done. Honestly, if your data isn’t accurate or relevant, well, any analysis you do based on it is just going to be flawed.
What Recruitment Data Should You Be Collecting?
Recruitment data pops up at lots of different points throughout the hiring process. Usually, your Applicant Tracking System (ATS) is going to be the main place it lives. That’s where you’ll find details about applications, which stage candidates are in, communications, and what the final outcome was. Your HR Information System (HRIS) will typically have data from after someone is hired, like their performance reviews and how long they’ve been with the company.
But there are other places too! Think about:
- Structured interview feedback forms (having a consistent format here is crucial).
- Results from candidate assessments (like tests or simulations).
- Feedback from candidate satisfaction surveys.
- Logs of what recruiters are doing.
- Information from your careers page analytics (how many people visit, do they leave right away?).
- Performance data from external job boards you use.
Making sure your data is clean and consistent across all these potentially separate systems is absolutely vital. If data is entered differently, or bits are missing, or you have duplicate records, it just makes your analysis unreliable. Setting up clear rules for data and making sure your teams know how to enter it properly is, I can’t stress this enough, a critical step.
Essential Recruitment Metrics & KPIs for Data-Driven Hiring
KPIs, or Key Performance Indicators, and other metrics are what turn that raw data into actual, measurable insights about how healthy and how well your recruitment process is doing. They really should line up with what you’re trying to achieve with your hiring. Grouping metrics helps you look at different parts of the process, which I think is helpful. Here are some important categories and examples:
- Funnel Metrics: These just track how candidates move through the different steps.
Applicant Conversion Rates: This is the percentage of candidates who successfully move from one stage (like applying) to the next (like getting screened). Looking at these rates by stage immediately shows you where people might be dropping off.
Drop-off Rates: Pretty much the opposite of conversion rate. If the drop-off rate is high at a specific stage, it’s a pretty good sign something isn’t working quite right there.
Source of Applicants/Hires: This is about figuring out where people are coming from – job boards, employee referrals, your own career site, social media, maybe recruiters actively reaching out. It’s key to know which sources bring in the most applicants, but even more important, which ones bring in the most hires.
- Efficiency Metrics: These measure how fast you’re hiring and how much it costs.
Time-to-Hire: The number of days from when someone first applies to when they accept the offer.
Time-to-Fill: This counts the days from when a job opening is officially approved to when an offer is accepted.
Cost-per-Hire: The total amount you spend on recruitment (internal costs plus external ones) divided by the number of people you hire over a certain time.
Interviewer Load: Average number of interviews each interviewer is doing. This can help you make sure nobody is getting burned out and resources are managed well.
- Quality Metrics: These are about how good your hires are and the impact they have.
Quality of Hire: This is often a combined score, bringing in things like how new hires are rated in their first year, how long they stay, if hiring managers are happy with them, and how quickly they get up to speed. It definitely needs you to link data from before they were hired with data from after.
Offer Acceptance Rate: The percentage of candidates who actually say yes when you give them a job offer. This can tell you something about how competitive your offers are, and maybe how the candidate experience felt.
- Diversity Metrics: These track representation as candidates move through the process.
Representation at each stage: Looking at the percentage of candidates from underrepresented groups at the application stage, screening, interviews, offer, and finally, hired. This really helps pinpoint exactly where diversity might be unintentionally getting blocked.
- Candidate Experience Metrics: Simply put, how happy are candidates with your process?
Candidate Satisfaction Scores: Results from those surveys you send out after someone applies or interviews. Things like a Net Promoter Score, but for candidates.
It’s worth noting these metrics often influence each other. For example, trying to cut down Time-to-Hire too much might, just maybe, affect the Candidate Experience or even the Quality of Hire if you’re rushing things. Looking at them all together really gives you the full picture. Understanding these metrics is, honestly, a must-have before you can do any effective Hiring Data Analysis.
The ‘How’ – Performing Hiring Data Analysis
Okay, so collecting the data and keeping tabs on your metrics? That’s just the first part, really. The truly valuable stuff comes when you actually take all that raw information and turn it into insights that you can do something with. That process, getting from raw data to understanding, is what we call Hiring Data Analysis. It’s about digging a bit deeper than just ‘what happened’ to figure out ‘why it happened’ and, hopefully, ‘what might happen next.’
Transforming Raw Data into Actionable Insights: The Process of Hiring Data Analysis
Doing Hiring Data Analysis effectively usually follows a sort of structured path. It just helps make sure you’re doing the analysis with a purpose, so it actually leads to real improvements you can see. Here are the key steps, I think:
- Figure out what you need to know: Start by asking specific questions. What do you really want the data to tell you? (Like, which source actually brings in the best people for us? Why are engineering roles taking longer to fill all of a sudden? Is there, perhaps, some unconscious bias creeping into our initial screening?)
- Gather the data: Pull together all the relevant information from wherever it lives – your ATS, HRIS, surveys, whatever you’ve got.
- Clean it up and get it ready: This is super important. Fix those inconsistencies, fill in missing bits where you can, deal with errors. Just make sure the data is in a format you can actually work with.
- Analyze it: Now you actually apply the right methods to answer those questions you started with.
- Make sense of what you see: Look at the patterns and trends in the data and try to understand what they mean in the context of your own recruitment process.
- Come up with plans: Based on what you’ve learned from the data, create concrete steps you can take to improve things.
- Put those changes into action: Go ahead and implement your strategies.
- Check the results: Go back and look at your metrics again. Did the changes you made actually work the way you hoped?
- Keep refining: Use the new data that’s coming in from your updated process to ask more questions. Find new things you can tweak and just keep making the process better. It’s really a continuous cycle.
Types of Analysis in Recruitment
Different ways of looking at the data can give you different levels of understanding.
- Descriptive Analytics: This is the most basic level, really. It simply tells you, “What happened?” You’re calculating and reporting on those key metrics – average Time-to-Hire, Cost-per-Hire, how many applications you got. It’s basically a snapshot of how things are right now.
- Diagnostic Analytics: This takes it a step further and asks, “Why did that happen?” It’s about looking at how metrics relate to each other to try and find the root cause of something. If a lot of candidates are dropping off at the interview stage, diagnostic analysis might involve looking at what people said in their feedback, or maybe if there were scheduling problems.
- Predictive analytics: Now we’re trying to look ahead, asking, “What is probably going to happen?” This uses historical data and statistical models to try and forecast future stuff. Could be predicting future hiring needs based on how the business is growing, or trying to spot which candidates are most likely to be high performers, or even predicting if someone might be thinking about leaving.
- Prescriptive Analytics: This is the most advanced, and it’s about telling you, “What should we do?” It takes the insights you got from predictive analytics and suggests specific actions. For example, if the predictive analysis strongly suggests that doing a particular assessment is linked to hiring really high performers, prescriptive analysis might recommend giving that assessment score more weight when you’re deciding who to hire.
Analyzing the Recruitment Funnel
Looking at your recruitment funnel is, honestly, a pretty fundamental part of Hiring Data Analysis. It’s all about tracking the number – and the percentage – of candidates who actually make it from one stage to the next. Seeing the funnel visually can just really quickly show you where candidates are entering, moving along, and where, crucially, they’re leaving the process.
When you see stages with low conversion rates or where lots of people are dropping off, it immediately flags potential problem areas. Is the initial screening process just too tough? Are the interviews dragging on for too long? Is that assessment process really complicated and frustrating? Funnel analysis really helps you decide which parts of the process you need to focus your attention on first. Comparing your funnel numbers to what’s typical in your industry can also give you some helpful context about your performance.
Correlation and Causation in Hiring Data
Here’s something really critical when you’re trying to understand what your Hiring Data Analysis is telling you: understanding the difference between correlation and causation. Correlation just means two things seem to happen together (like, candidates from Source A often seem to get high Quality of Hire scores). Causation means one thing directly makes the other thing happen (like, okay, maybe implementing structured interviews actually caused that increase in Quality of Hire).
Just because two metrics look like they’re linked doesn’t necessarily mean one is causing the other. There could be some other factor you haven’t even thought of that’s influencing both. To draw solid conclusions and actually make changes that will work, you ideally want to establish causation. That often involves running controlled experiments or doing more advanced statistical analysis. Just relying on correlation alone, I think, can easily lead you down the wrong path with your strategies.
The Tech Stack – Essential HR Reporting Tools and HR Analytics Software
To really make data work for you in recruitment, you need the right technology, let’s be honest. While you can do some basic reporting with just spreadsheets, getting to that truly transformative Hiring Data Analysis level really needs more powerful tools. The world of HR technology offers quite a range, everything from the reports built right into your ATS to full-blown analytics platforms. Picking the right tools is, I’d say, absolutely crucial for turning those data aspirations into actual results.
Choosing the Right Tools for Recruitment Analytics
What kind of tech you need for recruitment analytics is going to be different depending on how big and complex your organization is, and what your hiring goals are, of course. A smaller company that’s not hiring a huge number of people might be okay starting with pretty basic reports. But a large company, maybe hiring thousands of people every year, is definitely going to need a really robust, scalable solution.
HR Reporting Tools: The Foundation
Most Applicant Tracking Systems (ATS) you’ll find today come with some built-in HR Reporting Tools. These usually give you standard reports on things like Time-to-Hire, Cost-per-Hire, or just how many applications you’re getting. They offer, you know, a basic level of visibility into what’s happening in the process.
But, you know, those standard HR Reporting Tools often have their limits. The reports can feel a bit static, maybe you can’t customize them much, and trying to bring data together from different places (your ATS, your HRIS, assessment platforms) can be difficult, sometimes just impossible. While they’re perfectly useful for keeping an eye on basic performance, they generally fall a bit short if you want to do really deep diagnostic or predictive Hiring Data Analysis.
The Power of HR Data Visualization
Data is just so much easier to grasp – and honestly, to talk about with others – when you can actually see it. HR Data Visualization is all about taking those raw numbers and complex datasets and turning them into charts, graphs, and dashboards that just make sense intuitively. It really helps you spot trends, patterns, and anything that looks a bit out of the ordinary, and quickly too.
Having effective HR Data Visualization is, I think, incredibly important for several things:
- Figuring out where bottlenecks are in your hiring funnel really fast, perhaps using flow charts.
- Comparing how well different sourcing channels are working side-by-side using bar graphs.
- Getting a sense of how things like candidate characteristics might relate to how successful they are after they’re hired, maybe with scatter plots.
- Highlighting which areas are doing really well or maybe struggling with heatmaps.
- Simply explaining complicated insights clearly to people who aren’t necessarily data experts, like hiring managers or folks in the executive team.
Visualization just makes the results of your Hiring Data Analysis much more accessible and actually useful for everyone involved in hiring.
Deep Dive: What to Look for in HR Analytics Software
So, while those ATS reports are a starting point, getting dedicated HR analytics software is really what takes your data capabilities up a notch. These platforms are built specifically for doing more sophisticated analysis and reporting, not just for recruitment, but often across all of HR. They might connect into your existing HR Reporting Tools or, sometimes, they act as one central place for everything, replacing those separate, scattered systems.
When you’re thinking about getting HR analytics software, here are some key things, I’d say, to really look for:
- Ability to connect data: Can it easily pull data from your ATS, HRIS, payroll, assessment systems, anything else relevant? Having all that information in one place is absolutely essential for doing thorough Hiring Data Analysis.
- Reports and dashboards you can change: Can you build reports that are exactly what you need, and show the metrics in dashboards that make sense for different people – recruiters, hiring managers, executives?
- More advanced analysis: Does it support that diagnostic, predictive, or even maybe prescriptive analysis we talked about? Look for features that do things like correlation analysis, regression, or forecasting.
- Easy to use and good visualization: Is the software something your recruiters and HR people can actually navigate without needing to be data scientists? Does it have lots of good ways to visualize the data so it’s easy to understand?
- Security and privacy: This is non-negotiable, obviously. Given how sensitive HR data is, really strong security and making sure it follows rules like GDPR or CCPA is a must.
- Can it grow with you: Will the software be able to handle the amount of data you have now, and importantly, as your organization grows?
- Does it work with or replace current tools: Will it just add to what you have, or is it powerful enough that it could bring everything together and replace some of your current HR Reporting Tools?
Tools like HireOquick, for instance, are designed with features to support this kind of data-driven approach. They help you collect structured data through assessments you can customize, they’ve got AI that can help generate those assessments for consistency, and reporting features to track candidate progress and results. While it’s not just an analytics platform, having an ATS that’s good at capturing data is a really important part of your overall analytics tech setup.
Implementing Data-Driven Hiring – From Strategy to Action
Okay, so actually doing data-driven hiring – that’s a journey, really, not something you just arrive at. It definitely needs a clear strategy, having the right tools in place, and being ready to manage the changes that come with it. Simply getting some HR analytics software, while helpful, isn’t enough on its own. You have to really embed the use of data into what your recruitment teams do every day, and how decisions are made. Implementation is all about planning things out, doing it, and then just continuously making it better.
A Step-by-Step Guide to Implementing Data-Driven Recruitment
Here’s, I think, a pretty practical way to go about actually putting data into action:
- Pin down your hiring goals and questions: Start by figuring out exactly what you want to achieve. (Like, maybe you want to make Quality of Hire 10% better, or cut Time-to-Hire by a week). Then, work out the specific questions that data could help you answer. (Things like, what are the common traits of our best people? Why is it taking so long to hire engineers specifically? Could there be bias in how we screen candidates?)
- Figure out which metrics you need: Based on those goals and questions, decide exactly which key recruitment metrics and KPIs you need to keep track of. Just make sure they are things you can actually measure and that they link back to what you’re trying to achieve.
- Make sure your data collection is solid: Get your systems – your ATS, HRIS, assessment platforms – set up or tweaked so they collect the data you need, and do it accurately and consistently. This is really where getting the right HR analytics software or integrating what you have is super important for pulling all that data together.
- Analyze the data (that’s your Hiring Data Analysis): Make analyzing the data a regular thing using the tools you’ve chosen. Start with just looking at the basics to understand where you are now, then gradually move towards analyzing why things are happening the way they are.
- Understand the insights and plan your actions: Turn those data findings into simple, clear insights. What is the data actually telling you? Based on that, create concrete plans for what you’re going to do to fix problems or take advantage of opportunities. (Maybe the data shows that candidates from a certain source stick around 20% longer, so you decide to spend twice as much trying to find people there).
- Put the changes in place and see what happens: Go ahead and do the things you planned. This might involve changing parts of your process, updating job descriptions, training interviewers, or moving budget around. And the crucial bit: keep tracking your metrics to see if those changes actually had the effect you wanted.
- Keep iterating and improving: Data-driven hiring isn’t a one-off project; it’s about always getting better. Use the fresh data that comes from your improved process to ask new questions, find new areas you can optimize, and just keep refining how you do things.
Training Your Team on Data Literacy
Building a culture that uses data really needs people who understand data, at least a bit. Your recruiters and hiring managers don’t suddenly need to become data scientists, obviously, but they should get why data is important, know how to look at basic reports and dashboards, and understand how the stuff they do every day impacts the quality of the data.
Training, I think, should cover things like:
- Why data-driven hiring is actually good for them and the whole company.
- How to make sure they’re entering data into systems correctly.
- How to find and understand the main reports and dashboards that your HR analytics software gives you.
- How to actually use the insights from data to help them make decisions in their daily work (like, maybe, who to focus on sourcing, or which candidates seem most promising).
- Why having consistent processes matters so much for getting reliable data.
Encouraging a bit of curiosity about data and showing the team how it can help them just makes everyone feel more empowered to use data as a tool to get better.
Communicating Data Insights to Stakeholders
The valuable insights you get from Hiring Data Analysis are, frankly, only useful if the people who need to see them – everyone from the top executives to the hiring managers – actually understand them and do something with them. How you communicate needs to be adjusted depending on who you’re talking to.
- For Executives: Focus on how it impacts the business itself – the return on investment, Quality of Hire, how it helps with strategic goals. Use those high-level dashboards and summaries, really emphasizing the “so what.”
- For Hiring Managers: Give them insights that matter to their specific roles and teams – like how long it’s taking to fill their jobs, or the Quality of Hire for people they approved. Show them clearly how data helps them build better teams, maybe faster.
- For Recruiters: Provide data that’s relevant to their own performance, the numbers for the roles they’re working on, and insights into candidate behaviour or which sources are working best, which directly affects their day-to-day work.
Using good HR Data Visualization is absolutely key to making your presentations clear and convincing. Visuals just help people quickly grasp complex information and see the story the data is telling.
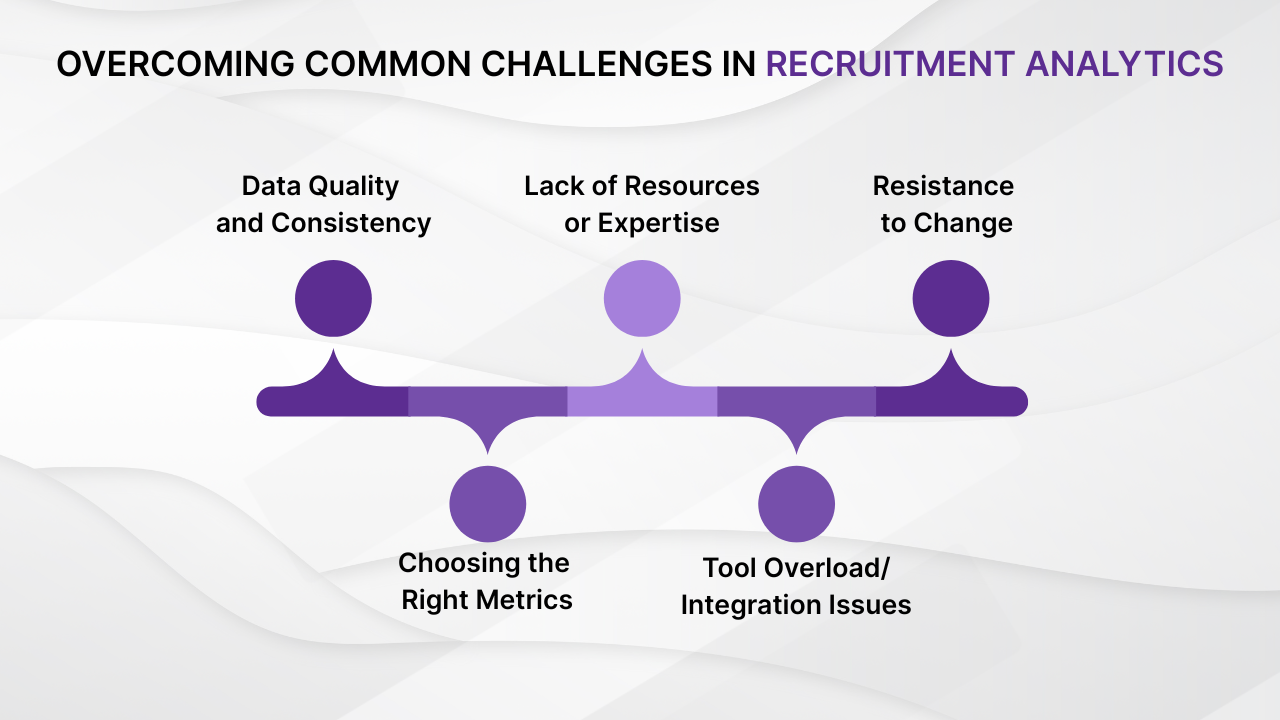
Overcoming Common Challenges in Recruitment Analytics
Getting started with this whole data-driven approach to hiring, well, it definitely comes with its own set of challenges, doesn’t it? Organizations pretty often run into hurdles, everything from the data not being quite right to people just being a bit resistant to change. Recognizing these potential roadblocks before you hit them and planning for them is, I think, pretty crucial for making Hiring Data Analysis successful. Having proactive strategies in place can really help you navigate these difficulties and hopefully make the transition feel a bit smoother and more effective.
Navigating the Hurdles: Solutions for Recruitment Analytics Challenges
Here are some of those common challenges you might face, and some ideas on how to deal with them:
Data Quality and Consistency
- The problem: Data that’s not accurate, or bits are missing, or it’s entered differently across various systems – it just makes your analysis unreliable.
- How to handle it: Put in place clear rules for how data should be entered and make sure people get trained on it. Use those built-in checks in your ATS and HR analytics software to validate data. Make a habit of regularly checking your data for errors, and definitely get some policies around data governance established. It helps so much if you can get your key systems to talk to each other – that reduces manual copying and, honestly, fewer chances for mistakes.
Lack of Resources or Expertise
- The problem: Maybe the team just doesn’t have the right skills yet to gather, clean, analyze, or truly understand the data.
- How to handle it: You could invest in training for the people you already have, focusing on data literacy and how to use those analytics tools. If the budget allows and you really need it, perhaps hire someone who specializes in HR data analysis. Remember to lean on what modern HR analytics software can do; many have interfaces that are pretty easy to use and some even automate parts of the analysis. Starting small, maybe just tracking a few core metrics, and gradually expanding from there can make it feel less overwhelming.
Resistance to Change
- The problem: People like recruiters or hiring managers might be comfortable with the way things are and feel a bit unsure about using data. Maybe they think it’s too complicated or that it somehow questions their own judgment.
- How to handle it: Communicate why you’re doing this, really clearly. Explain how using data will actually help them – maybe it makes their job easier, or helps them hire better people. Get them involved in deciding which metrics matter and in looking at the results. Make sure they get good training and ongoing support. And definitely, celebrate the little wins you get early on by using data insights; that really helps build confidence and buy-in.
Choosing the Right Metrics
- The problem: You might end up focusing on metrics that look good but don’t actually mean much for the business (“vanity metrics,” as they’re sometimes called, like just the sheer number of applications). Or maybe you track way too many things and just get lost in the data overload.
- How to handle it: Make sure the metrics you choose are directly tied to your main hiring goals and what the business is trying to achieve (focus on things like Quality of Hire, not just the volume). It’s probably best to start with a manageable core set, maybe 5 to 7 key metrics that give you a good overview – covering efficiency, quality, candidate experience, and diversity. And just make it a point to review and maybe tweak that list of metrics regularly.
Tool Overload/Integration Issues
- The problem: Having lots of different systems that don’t talk to each other (your ATS, HRIS, assessment tools, etc.) just makes gathering and analyzing data fragmented and, frankly, a pain.
- How to handle it: It’s probably a good idea to prioritize investing in HR analytics software that’s designed to integrate and pull data from all those different sources into one central place. Look for tools that have strong ways to connect (like robust APIs) or already have connectors built for the systems you use. If possible, try to consolidate some of your tools; that can really simplify your technology setup.
The Future of Recruitment Analytics: AI and Predictive Hiring
Recruitment analytics, it seems, is a field that’s just constantly changing, isn’t it? A lot of that is thanks to advances in technology. Artificial intelligence (AI) and more sophisticated ways of doing predictive modeling are pretty much set to completely change how companies find and hire talent. Understanding these trends is, I think, key to staying ahead in the world of data-driven hiring. The future really does look like it will offer even deeper insights and processes that are much more automated.
What’s Next? AI, Predictive Analytics, and the Evolution of Data-Driven Hiring
AI is already making its presence known in recruitment, taking over some of the repetitive stuff like sorting through resumes or sending out those first messages to candidates. When it comes to analytics, AI is getting pretty powerful at handling huge amounts of data that isn’t neatly organized (like the text in resumes or notes from interviews) and spotting those less obvious patterns.
Predictive analytics, which is powered by things like machine learning algorithms, is moving well beyond just basic forecasting now. It can increasingly be used to:
- Guess who might be a successful hire: Look at historical data to find traits, skills, or experiences that seem to really line up with people who did well in specific jobs before.
- See who might leave: Spot patterns in employee data that suggest someone might be thinking about quitting, giving you a chance to try and keep them before they do.
- Figure out the best places to look for candidates: Predict which channels are most likely to bring in people who not only apply but actually get hired and perform well down the line.
- Automate parts of screening: Use AI to give candidates scores or rank them based on criteria you’ve set and those predicted success indicators. That way, recruiters can spend their time talking to the candidates who look most promising. HireOquick’s features, like analyzing resumes using AI or creating assessments with AI help, are examples of how AI is starting to make parts of this process faster and easier.
But, of course, with more AI and predictive analytics comes important ethical considerations. Making absolutely sure that the algorithms you use aren’t biased is incredibly important if you want your hiring practices to be fair and equitable. Being clear about how you’re using data and how decisions are being made is also really crucial. The future of Recruitment Analytics, I believe, lies in using these powerful tools, but doing it responsibly.
Case Study/Example
Understanding data-driven hiring just in theory is one thing, isn’t it? Seeing a real-world example of it in action really helps make it concrete. This case study is here to show you how a hypothetical company decided to use data and analytics to get past a pretty big recruitment challenge they were facing. It walks through what they did, the tools they used, and the clear improvements they actually achieved.
Case Study: How Innovate Corp Used Data to Transform Hiring
Okay, so imagine Innovate Corp, they’re a tech company, maybe mid-sized. They had this growing problem: it was taking them way, way too long to hire people. Their Time-to-Hire for key engineering roles was climbing, averaging around 65 days. That delay was causing projects to slow down, important jobs were staying empty, and it was impacting how productive they were and, frankly, probably their revenue. They also had a sneaking suspicion that the Quality of Hire wasn’t as consistent as it really needed to be; some new folks were just struggling to get up to speed effectively.
Their main problem, I think, really came from a hiring process that was mostly manual and just not very consistent. Recruiters often went with their gut, interview feedback wasn’t structured the same way, and they weren’t really keeping track of how candidates were moving through the process consistently across all the different places they looked for people. The basic reports from their ATS would tell them the average Time-to-Hire, sure, but they couldn’t tell them why it was so high.
To fix this, Innovate Corp decided they needed to really commit to a data-driven approach.
- They Set Goals: They wanted to cut their Time-to-Hire by 15 days and make Quality of Hire better by finding clearer ways to select candidates.
- They Figured Out Metrics: They focused on Time-to-Hire, but specifically broken down by each stage of the process, Conversion Rates at each stage, where people were hired from (Source of Hire), interview scores (making sure the forms were structured), assessment results, and those post-hire Performance Ratings (this was key for Quality of Hire).
- They Got the Right Data Setup: They made sure everyone used their ATS properly and, crucially, they brought in some dedicated HR analytics software. This software could connect to their ATS and their system for managing performance. They also started using proper, structured forms for interview feedback.
- They Did the Hiring Data Analysis: Using their new HR analytics software, they really dug into their funnel data.
First, HR Data Visualization – looking at a funnel chart – immediately showed a pretty big drop-off (more than 40%!) between when a recruiter first screened someone and when they had their first technical interview.
Diagnostic analysis helped them link this drop-off to the fact that the screening questions weren’t consistent, and maybe it wasn’t clear enough upfront what technical skills were really essential.
Correlation analysis, using their HR analytics software alongside that post-hire data, revealed something really interesting: how well someone did on a specific coding assessment had a really strong link to how well they were rated after they were hired. The scores from those less structured interviews? Not so much, it turned out.
- They Created Action Plans: Based on what the data showed them, they decided to make two pretty significant changes:
They rewrote the script recruiters used for initial screening. It now included specific, standard technical questions that were clearly tied to what the job actually needed.
They decided to give the score from that coding assessment more weight when evaluating candidates. They also made sure their interviewers were trained on how to conduct structured interviews properly.
- They Made the Changes and Tracked Everything: They rolled out the new process. And importantly, they kept a close eye on their metrics, using the standard HR Reporting Tools in their ATS for basic checks and the deeper capabilities of their HR analytics software for more detailed analysis.
The Results: Within just six months, Innovate Corp saw some really notable improvements.
- That big drop-off between screening and the first technical interview? It decreased by a solid 25%.
- Their average Time-to-Hire for those engineering roles came down to 52 days. That’s a reduction of 13 days – getting them really close to their 15-day goal.
- And, critically, their Quality of Hire metric (based on performance ratings and how quickly new hires got effective) showed a measurable increase. This really validated that the changes they made, backed by data, were working.
By really using data to figure out the core reasons for their problems and then letting that information guide specific changes to their process, Innovate Corp managed to turn recruitment from being a real bottleneck into, frankly, a strategic advantage. It just goes to show, I think, the real power of Hiring Data Analysis and having the right HR analytics software to make it happen.
Frequently Asked Questions (FAQs) About Data-Driven Hiring
Getting into data-driven hiring often brings up some practical questions, doesn’t it? Here are some answers to questions people commonly ask about recruitment analytics, HR analytics software, and getting started with Hiring Data Analysis.
Your Questions Answered: Navigating Recruitment Analytics
What’s the difference between HR metrics and HR analytics?
Think of HR metrics as just the individual numbers or measurements – like “How long did it take to hire someone?” or “How many applications came from this source?” HR analytics, on the other hand, is what you do with those metrics. It’s the process of looking at them, understanding what they mean, finding patterns, diagnosing problems, and maybe even trying to predict what might happen. Metrics are just the building blocks, really; analytics is like the intelligence you build from them.
How do I even start collecting hiring data if I don’t have an ATS?
Starting small is probably the best way to go. Even without a full ATS, you can definitely use simple spreadsheets. Track basic stuff like where applicants came from, when they applied, which stage they’re in (you’ll have to update this manually, of course), and what the final result was. Make sure interview notes are saved consistently, and assessment results too. It will be limited, sure, but it lets you at least calculate those basic metrics yourself. Though, honestly, investing in a system like an ATS pretty quickly becomes necessary if you plan to scale or do any proper Hiring Data Analysis.
Is HR analytics software something I really need, or can I just stick with spreadsheets?
For just looking at a few basic metrics, maybe spreadsheets are okay to start with. But if you want to do any serious Hiring Data Analysis – pulling data together from lots of different places, running more advanced tests, creating dashboards that update automatically, and dealing with a decent amount of data – then HR analytics software is, I’d say, highly recommended. Spreadsheets just get really difficult to manage, mistakes are easy to make, and they simply don’t have the capability for deep insights or doing good HR Data Visualization easily.
How often should I be looking at my hiring data?
How often you look really depends on how much hiring you’re doing and which metrics you’re focused on. Metrics about how efficient you are, like Time-to-Hire or how many people move through your funnel, are probably good to check monthly or maybe every quarter to spot trends. Quality of Hire needs that post-hire data, so looking at that quarterly or perhaps twice a year, tied to when performance reviews happen, makes sense. DEI metrics, I think, should definitely be looked at regularly, maybe quarterly, just to see if you’re making progress. Consistency is key, whatever frequency you choose.
What are some of the most common mistakes companies make when doing Hiring Data Analysis?
Oh, there are a few common ones I’ve seen.
- Collecting lots of data, but then just… not actually analyzing it.
- Analyzing the data, but then not doing anything based on what they learned.
- Having really poor data quality, which means whatever conclusions you draw are probably wrong.
- Getting sidetracked by too many metrics, or the wrong kind (those vanity metrics again).
- Not explaining the insights clearly enough to the people who need to act on them.
- Not giving the team the right tools (HR analytics software) or the training they need to use them.
Can data actually help you figure out if someone is a good cultural fit?
That’s a really interesting question, because ‘cultural fit’ can feel pretty subjective, right? But data can offer some more objective clues. You could look at how things like results from personality tests, values assessments, or structured answers from behavioral interviews correlate with how well someone performs after they’re hired, or how long they stay, or feedback from their team, or how they do on projects where they have to work closely with others. It’s definitely not a perfect science, but data can help you see patterns that seem to link to people fitting in and doing well within your company’s culture. It’s more about complementing human judgment, I think.
Conclusion: Embrace the Data Revolution in Recruitment
You know, I think the time when companies just relied on intuition when hiring is, well, it’s really starting to pass. Data-driven hiring isn’t just some passing trend; it feels like a fundamental shift towards a way of building teams that’s just smarter, more efficient, and honestly, more effective. By making a conscious effort to collect, look at, and actually act on your recruitment data, organizations can make better decisions. Decisions that, frankly, directly impact their bottom line and how competitive they are.
We’ve talked about why it’s so important – everything from making Quality of Hire better and cutting costs, to really boosting DEI efforts and seeing a better return on investment. We have covered what data matters – the key metrics and points you should be looking at. We’ve really gotten into how to do it – the whole process and the different ways of doing Hiring Data Analysis to turn that raw data into insights you can actually use. And, I think, it’s crucial we highlighted the role of technology here, emphasizing that having powerful HR analytics software and being able to do good HR Data Visualization are absolutely key to making all of this work.
Getting data-driven hiring up and running does take commitment, people need to understand the basics of data, and you need the right tools. There will probably be challenges along the way, but honestly, the benefits of getting past them are pretty significant. The future of recruitment, especially with AI and predictive analytics getting more advanced, is just going to be even more focused on data, it seems.
Embracing data doesn’t mean you’re taking the human element out of the process, not at all. It’s about using objective evidence to give your recruiters and hiring managers the power to make better decisions – the human ones. It’s about genuinely understanding what makes someone successful in your organization and then building a recruitment process that reliably brings you that kind of talent. So, perhaps start by just taking a look at the data you already have today. Think about the tools that could really help you step things up, from maybe just better features in your ATS to getting that dedicated HR analytics software. The data revolution in recruitment is definitely happening – you just want to make sure you’re part of it.